Module: Visualisation
The module visualisation is a module for …
Examples
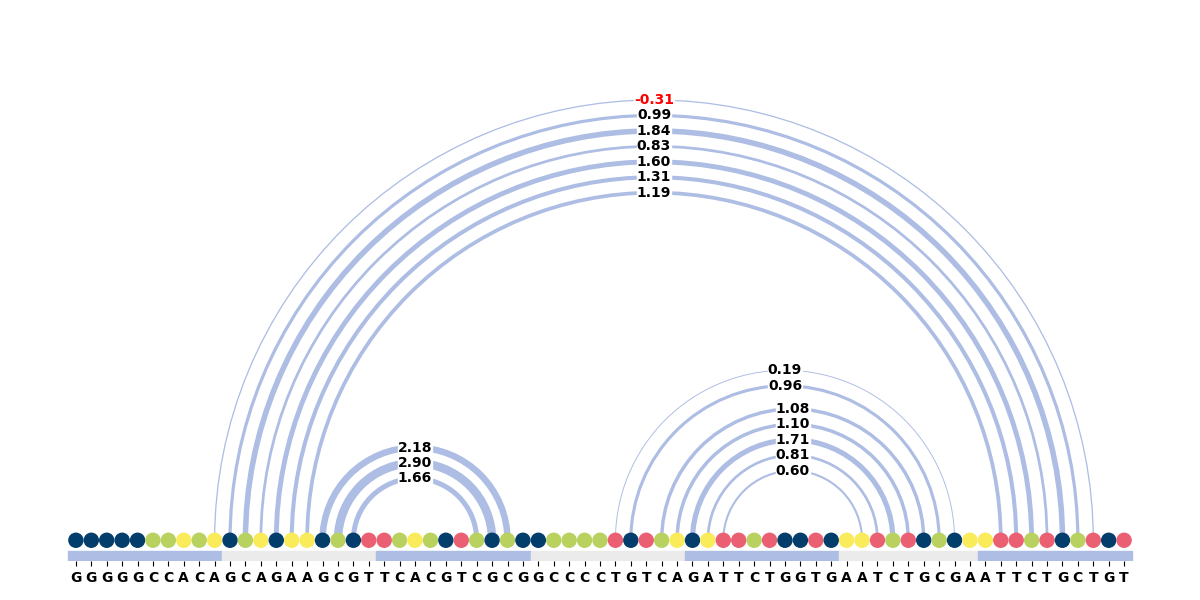
Arcdiagram
Draw an arcdiagram with connections between the secondary structure contacts:
 1import matplotlib.pyplot as plt
 2from BioHelpers_FABER.visualisation import RNA_Arc
 3
 4
 5def main() -> None:
 6    plot = RNA_Arc(
 7        "GGGGGCCACAGCAGAAGCGTTCACGTCGCGGCCCCTGTCAGATTCTGGTGAATCTGCGAATTCTGCTGT",
 8        [
 9            1.6604664325714111,
10            2.90354323387146,
11            2.1825625896453857,
12            0.5971742272377014,
13            0.8108296990394592,
14            1.7135246992111206,
15            1.102308988571167,
16            1.0844101905822754,
17            0.9618269205093384,
18            0.19237223267555237,
19            1.1943042278289795,
20            1.3098340034484863,
21            1.6046257019042969,
22            0.8343143463134766,
23            1.839804768562317,
24            0.994997501373291,
25            -0.31095585227012634,
26        ],
27        ".........((((((((((.......)))......((.(((((........)))))))..)))))))..",
28    )
29    plot.create_fig_ax()
30    plt.tight_layout()
31    plt.show()
32
33
34if __name__ == "__main__":
35    main()
Ouput:

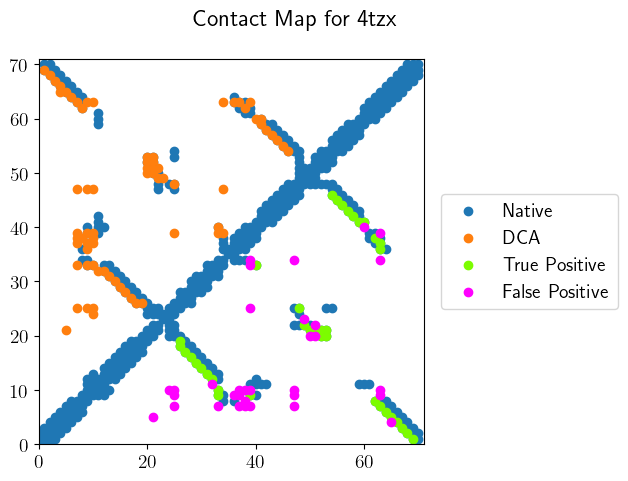
Contact Map
Draw a contact map with marking TP and FP.
1from BioHelpers_FABER.visualisation import show_contact_map
2from BioHelpers_FABER.cmap import Cmap
3
4# Create your Cmap object
5cmap = #some cmap object
6
7fig, ax = show_contact_map(cmap, ["DCA"], mark_match=True)
8plt.show()
Output:

Members
- class BioHelpers_FABER.visualisation.RNA_Arc(sequence: str, weights: list[float], sec: str)
Class to create an sequence, secondary structure representation Needs sequence as str weight as list of floats and seconadry structure as str
- create_fig_ax(figsize: tuple[float, float] = (12, 6), shrinking: float = 1, fontsize: int = 10) tuple[Figure, Axes]
Returns arc diagram
- Parameters:
figsize (tuple[float, float], optional) – overwrite standard figsize, defaults to (12, 6)
shrinking (float, optional) – shrinks the residue circles, defaults to 1
fontsize (int, optional) – overwrite font size, defaults to 10
- Returns:
figure and axes for matplotlib
- Return type:
tuple[matplotlib.figure.Figure, matplotlib.axes.Axes]
- BioHelpers_FABER.visualisation.show_contact_map(cm: Cmap, con_list: list[str], show_native: bool = True, mark_match: bool = False, **kwargs) tuple[Figure, Axes]
Method calls matplotlib and draws the contact map.
- Parameters:
cm (Cmap) – Contact map object
con_list (list[str]) – List of keys, which contacts are shown.
show_native (bool, optional) – Toggle if Native contacts are shown, defaults to True
mark_match (bool, optional) – Toggle if TP and FP are marked, defaults to False
- Returns:
Figure and axes object from matplotlib
- Return type:
tuple[matplotlib.figure.Figure, matplotlib.axes.Axes]